- This note provides an analysis of returns and volatilities of selected stock market indexes and offers several observations.
- Authors: Evgeny Maslennikov and Jinhan Wang. Contact: info@hpisinc.com.
- Data from 2013-01-01 to 2023-01-01. Sources: Yahoo Finance, Investing.com
- Units: return in % and standard deviation converted to % values.
- Total returns are calculated using index values between selected dates and volatilities are measured by standard deviation of daily returns between those dates.
- Returns and standard deviations are provided for several periods:
- 10 years and 5 years for the evaluation of long- to mid-term performance of the markets;
- Since 2020-04-01 for the evaluation of performance since COVID-19 lockdowns;
- Since 2022-01-01 for the evaluation of performance since the S&P 500 all-time high value.
- The stock markets of leading countries and regions are represented by the following indexes:
- North America: S&P 500 (SPX), Dow Jones Industrial Average (DJI), NASDAQ 100 (NDX), NASDAQ Composite, Russel 2000, and the S&P/TSX Composite of the Toronto Stock Exchange, Canada;
- China: Hang Seng, Shanghai Shenzhen 300, and TSEC/TWII;
- Eurozone: EURO STOXX 50 (Eurozone 50) and Euronext 100 (Eurozone 100).
- All other countries are represented by a single stock market index as follows:
- EMEA: FTSE 100 (UK), DAX Performance (Germany), CAC 40 (France), BEL 20 (Belgium), MOEX (Russia), TA-125 (Israel), Tadawul All Share (Saudi Arabia), South Africa Top 40 (South Africa), NSE All Share (Nigeria).
- APAC: BSE SENSEX (India), Nikkei 225 (Japan), KOSPI Composite (South Korea), STI (Singapore), S&P/ASX 200 (Australia), S&P/NZX 50 (New Zealand), IDX Composite (Indonesia), FTSE Bursa Malaysia KLCI (Malaysia).
- Americas: IBOVESPA (Brazil), IPC Mexico (Mexico), S&P/CLX IPSA (Chile).
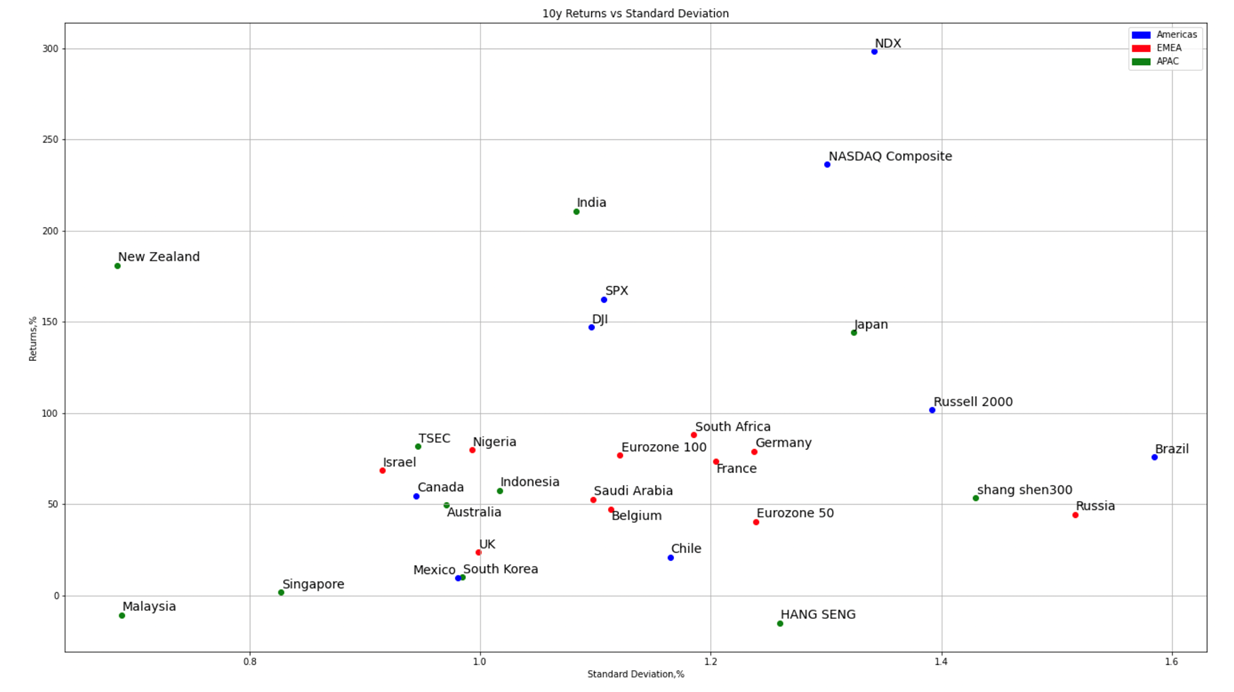
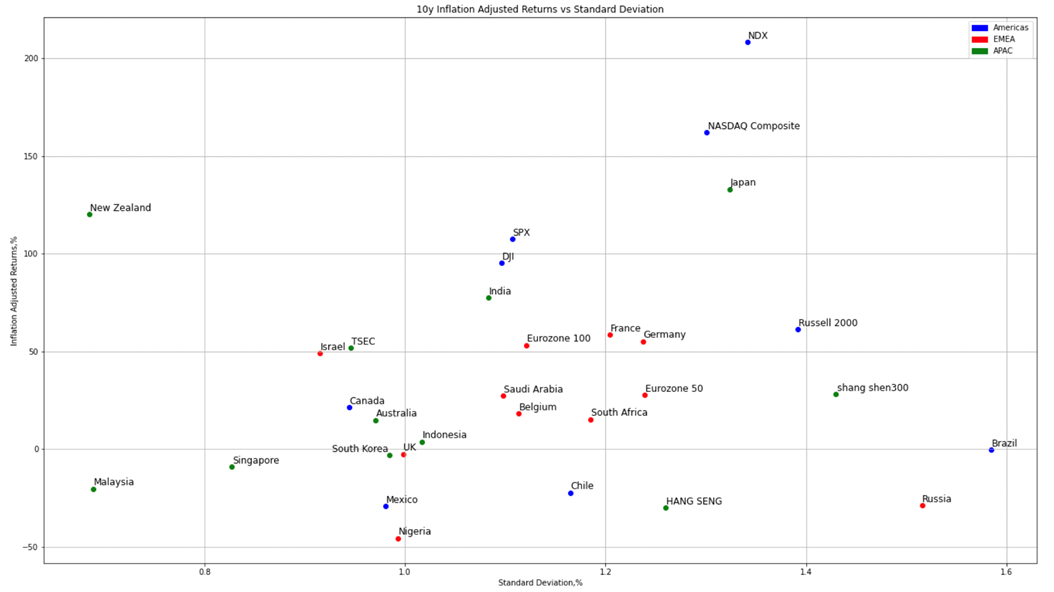
Observations from the 10-year dataset:
- The 10-year returns are characterized by U.S. leadership, followed by a large group of EMEA and APAC indexes, representing the middle. Many APAC markets were lagging in the 10-year period, including Hong Kong, Malaysia, Singapore, and South Korea. Brazil, Russia, and China were the most volatile markets in this period.
- Markets in the Americas yielded the highest returns, with all U.S. indexes returning over 100%. Led by technology, NDX return reached almost 300%, trailed by the broader NASDAQ Composite at 236%. The DJIA and the S&P 500 returned nearly identical returns of 147% and 162% respectively, and comparable daily volatilities. The small cap Russel 2000 returned 101% and with the highest volatility among U.S. indexes.
- Other markets with high returns were India (211%), New Zealand (181%), and Japan (144%). Notably, New Zealand delivered the 4th highest return with the lowest volatility of all markets. Japan, on the other hand, delivered a return comparable to the S&P 500, but at the cost of the 6th highest volatility among the profiled global markets. India, the only BRICS county with a return over 100% in this 10-year period, did that with a volatility comparable to that of the S&P 500.
- The South African market returned nearly 90% with volatility comparable to that of major European markets. The leading indexes in Brazil, Russia, and China delivered comparable returns of 50-70%, but the three represented the most volatile markets globally during these 10 years.
- The Hang Seng (-15%), Singapore (1.5%), and Malaysia (-11%) delivered the lowest returns of all markets. Hang Seng also holds the distinction of being the 7th most volatile market in the 10-year period. The Taiwanese market delivered the 4th best return in the APAC region with 82%, and with the 5ht lowest volatility.
- Most EMEA markets delivered a return of 40-80%, with the notable exception of the U.K., which returned 24%. Notably, Nigeria (80%) was the 2nd best performing market in the EMEA region after South Africa.
- The returns and volatilities of the remaining indexes may be viewed in two groups. The leading group, including Australia, Indonesia, and Canada delivering returns in the 50% to 57% range, and Chile, Mexico, and South Korea lagging with returns of only 9% to 21%.
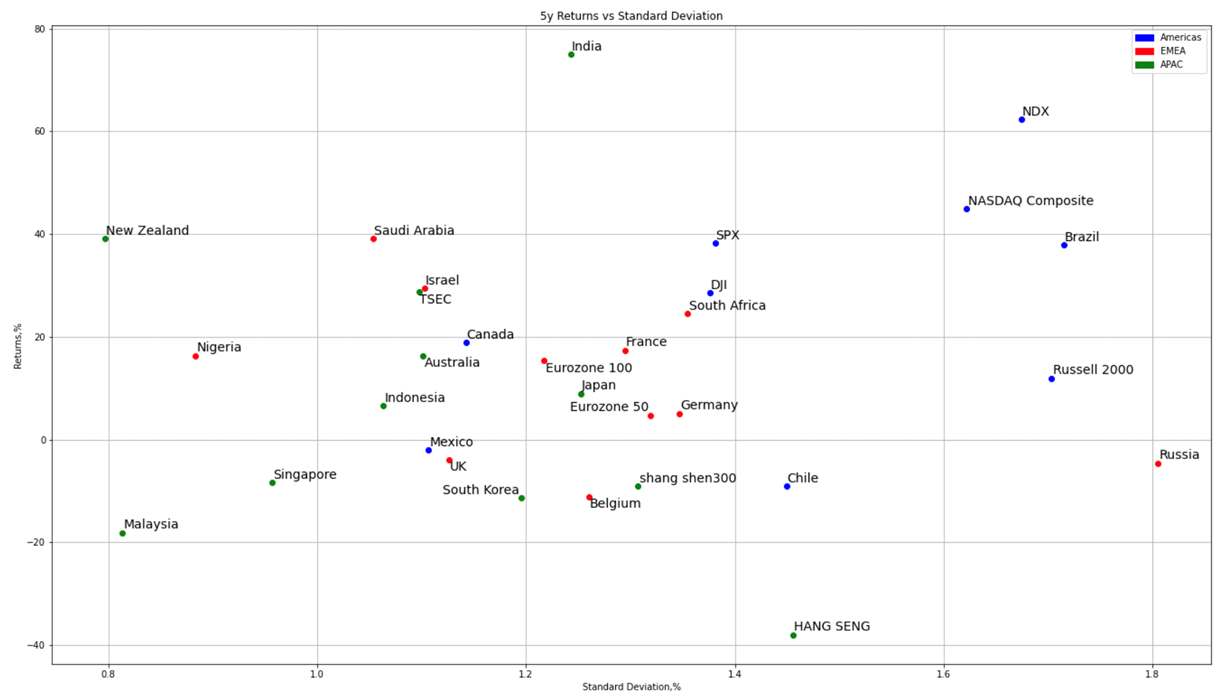
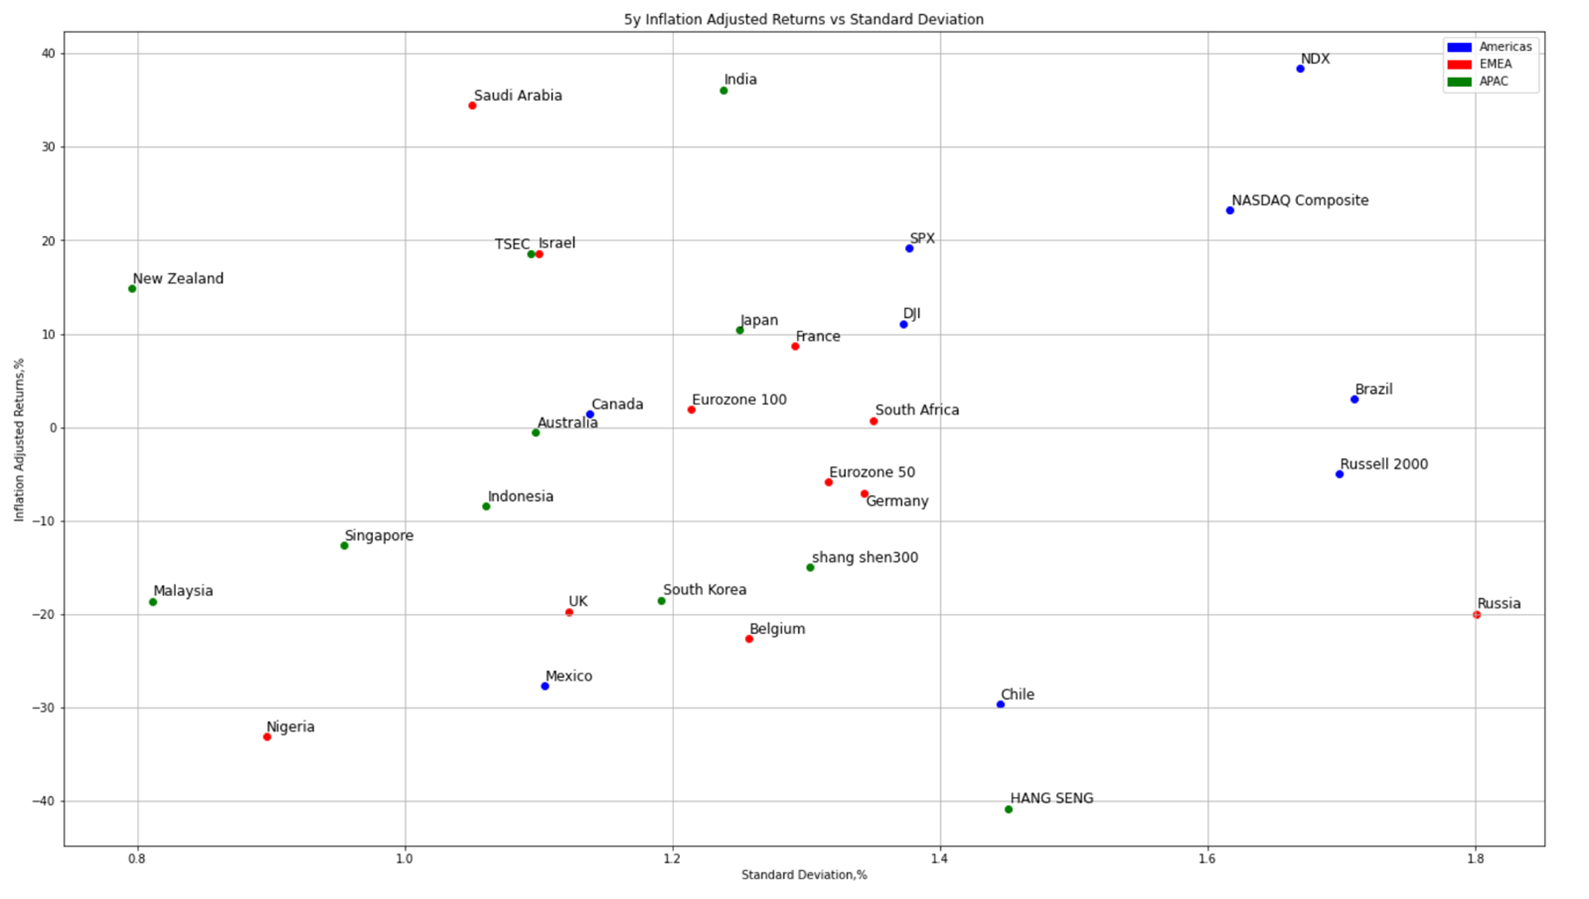
Observations from the 5-year dataset:
- Over the past 5 years, the general pattern of returns was similar to the 10-year picture. The markets were led by the U.S., India (75%), and New Zealand (39%), with the APAC markets lagging, and EMEA in the middle. Among the U.S. markets, NASDAQ was leading with (62%) and Russel 2000 lagging with (12%) return. The S&P 500 returned 42%, slightly ahead of the DJIA 29% return, and with comparable volatility, just like in the 10-year period. Within EMEA, the UK (-4%) and Belgium (-11%) were still behind the pack. Besides the overall similarity, there were several notable differences.
- While Russia and Brazil were still the two most volatile markets, Brazil returned nearly 40% and Russia had a loss of -5%. The leading Chinese index, the CSI 300, stood apart from the group with a volatility lower than that of the S&P 500, but a negative return of -9%.
- Another notable result in the last 5 years was the leadership of Saudia Arabia (39%), Israel (29%), South Africa (25%), and Nigeria (16%) in the EMEA region. Nigeria was also the 3rd least volatile market. The returns of continental European markets were comparatively lower: France (17%), Eurozone 100 (15%), Germany (5%), Eurozone 50 (5%). The Taiwanese market performed as the leading EMEA markets, returning 29%.
- The group of lagging markets in the last 5 years included Hong Kong (-38%), Malaysia, (-18%), South Korea (-11%), and Singapore (-8%). Overall, 10 markets out of [31] had a negative return in the last 5 years.
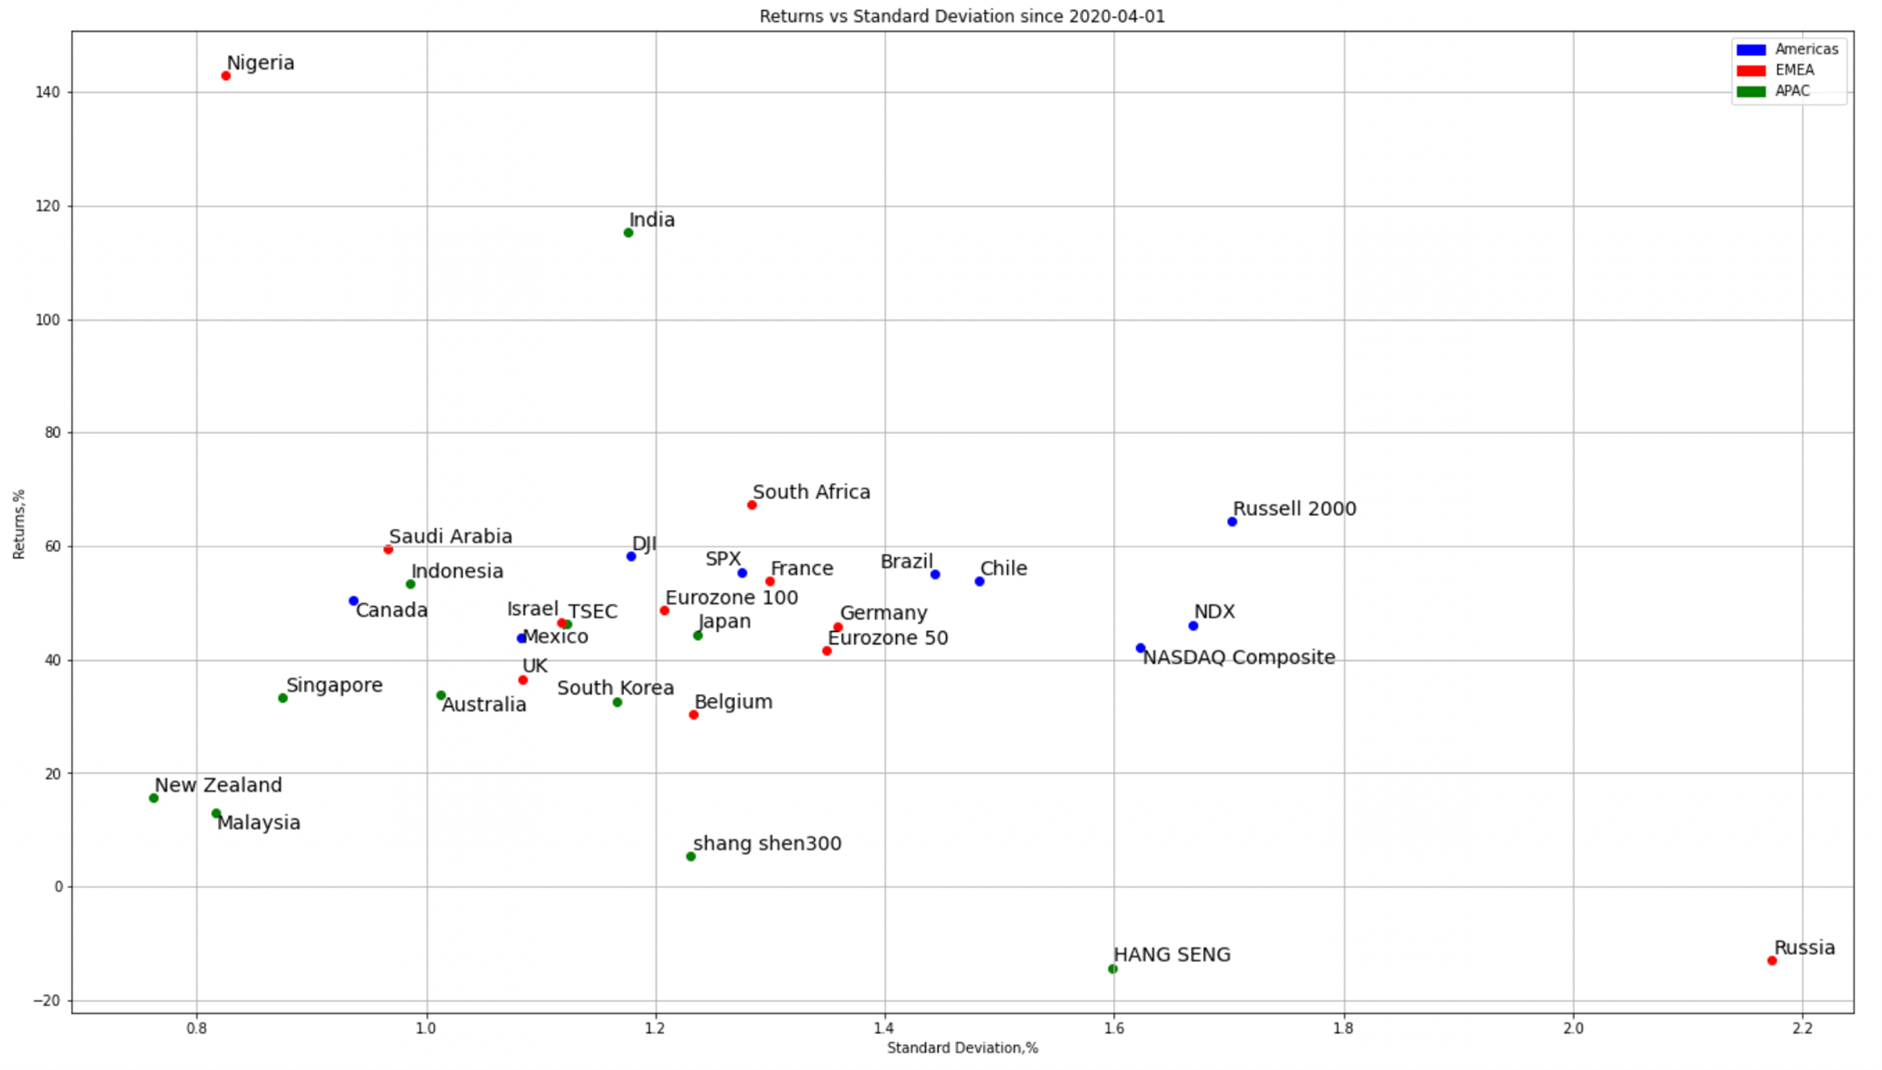
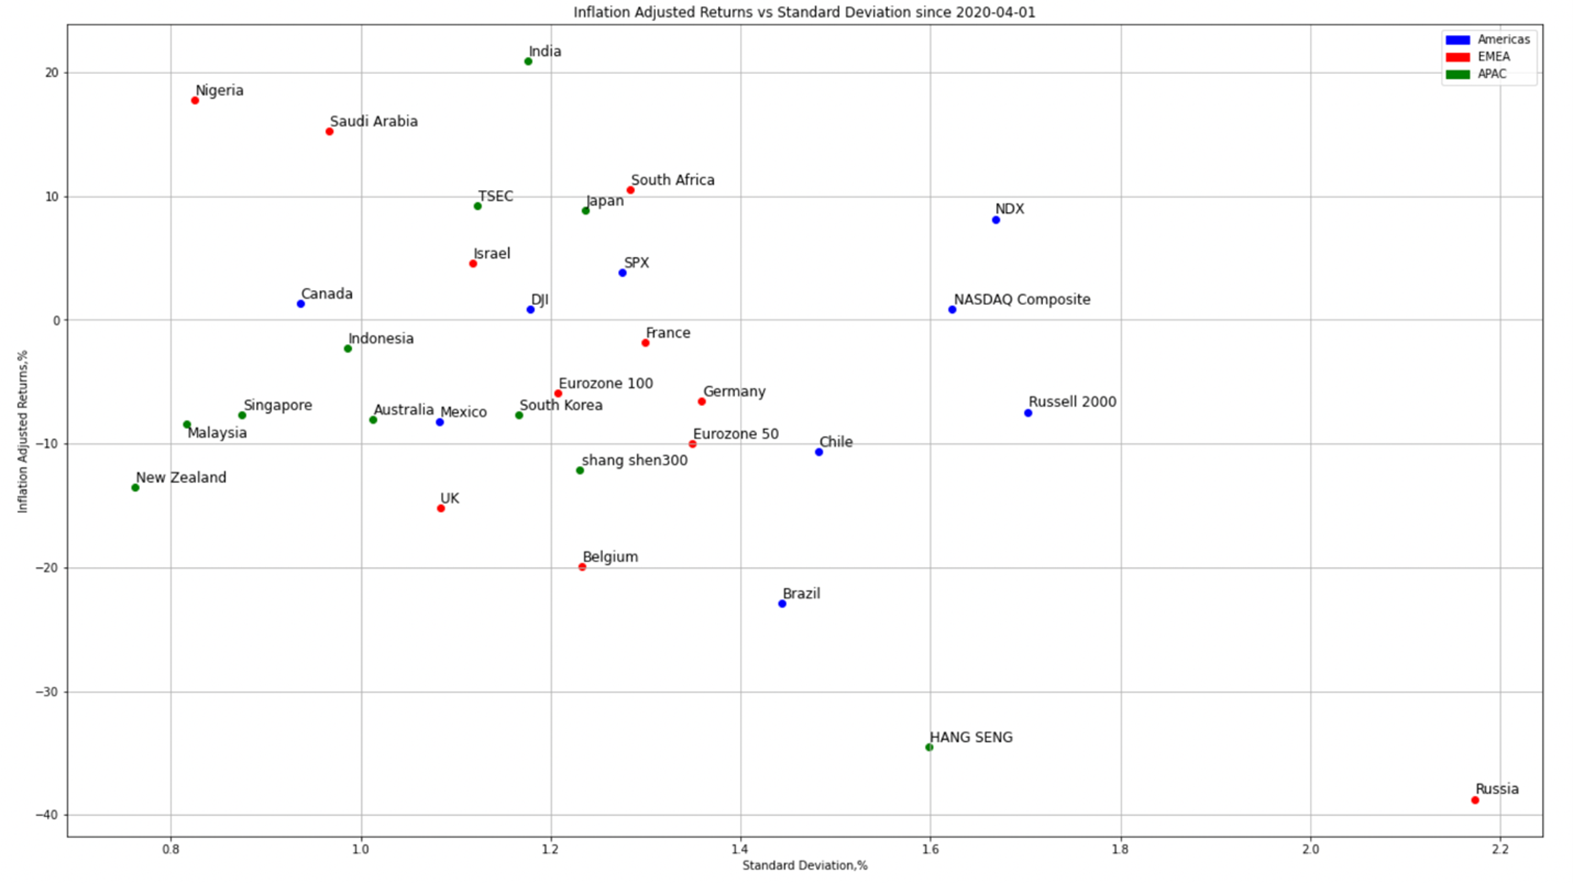
Observations since COVID-19 (since 2020-04-01):
- Returns since the peak of lockdowns related to COVID-19, were positive in all markets except Russia (-13%) and Hong Kong (-14%). Slightly better than that, CSI 300 (5%) and Malaysia (13%). New Zealand returned 16%, the only other market with a less than 20% return in this period.
- In the U.S., it is notable that Russell 2000 (64%) performed better than the other U.S. markets, with NASDAQ 100 (46%) and NASDAQ Composite (42%) lagging even the S&P 500 (55%) and DJIA (58%).
- Like in the 10-year and 5-year analysis, the performance of Nigeria (142%), India (115%), South Africa (62%), and Saudi Arabia (67%) stood out. It is especially notable that the Nigerian market was not only the best performing, but also the 3rd least volatile.
- [22] out of [31] markets performed in the range between 30% and 60%.
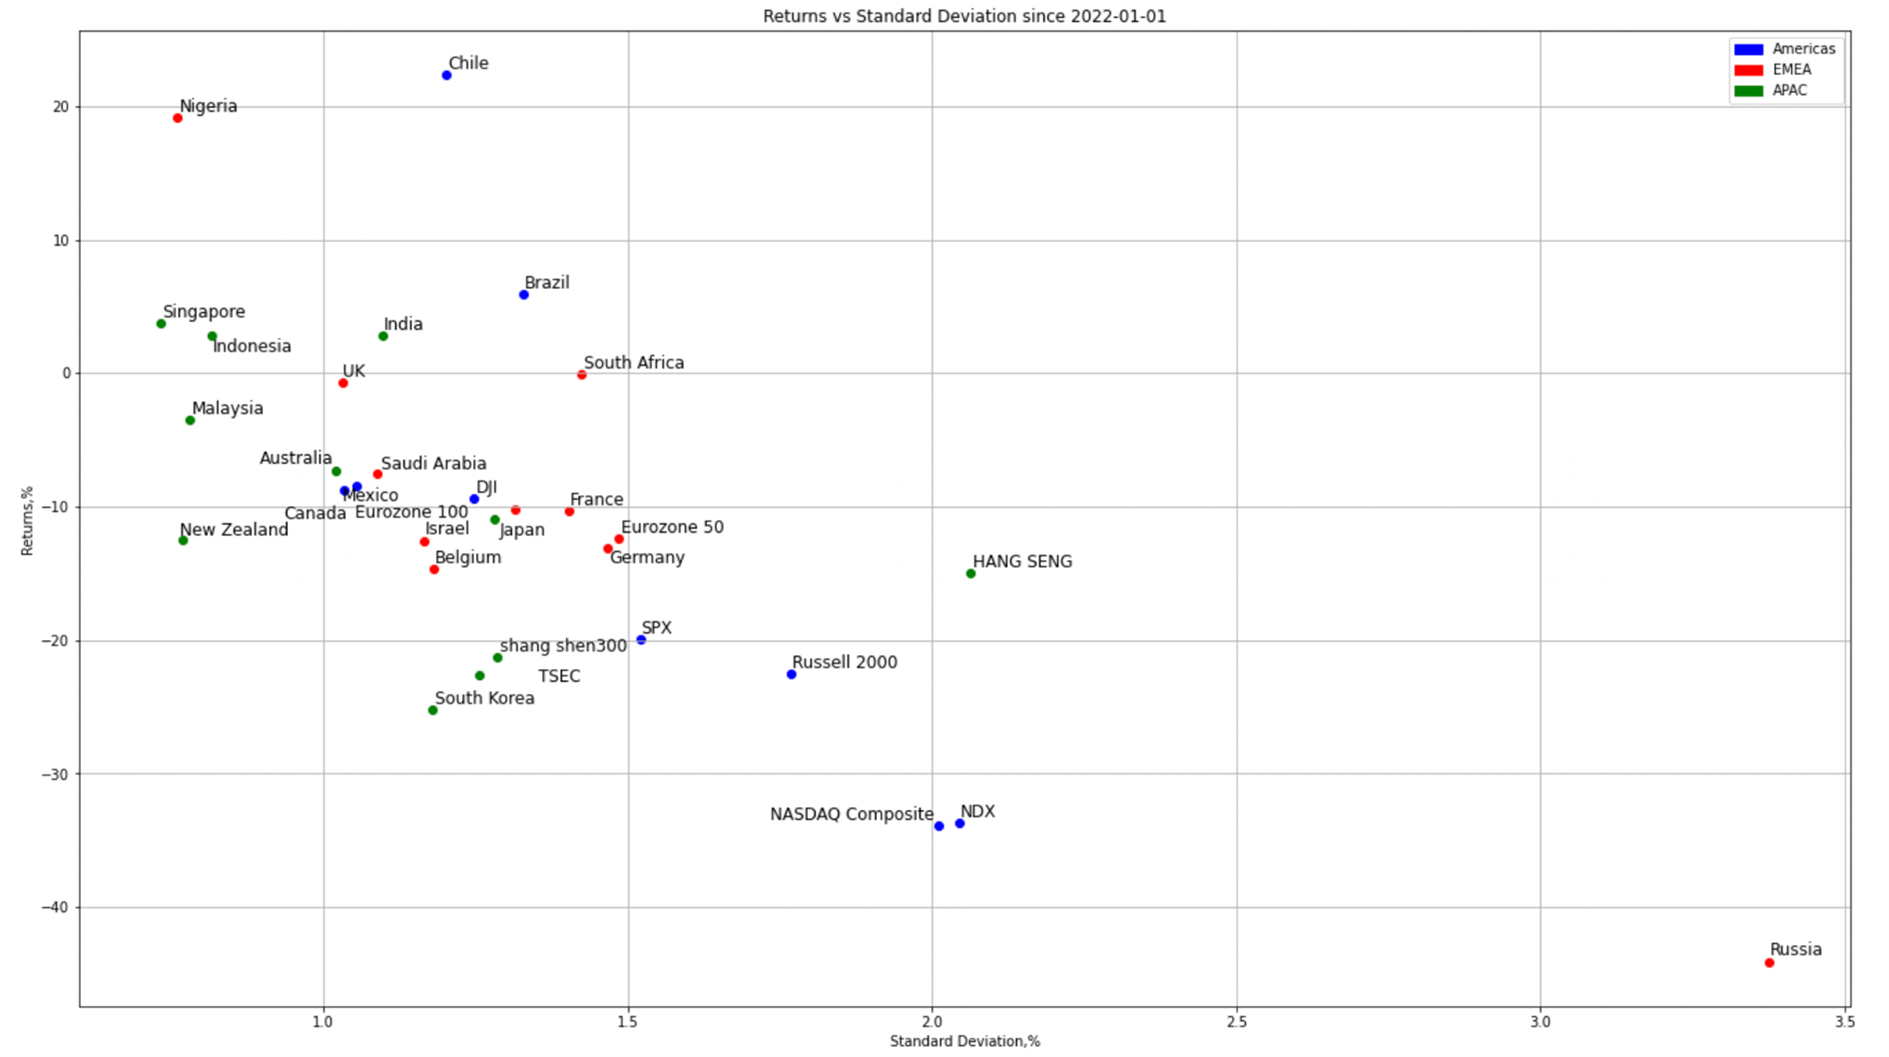
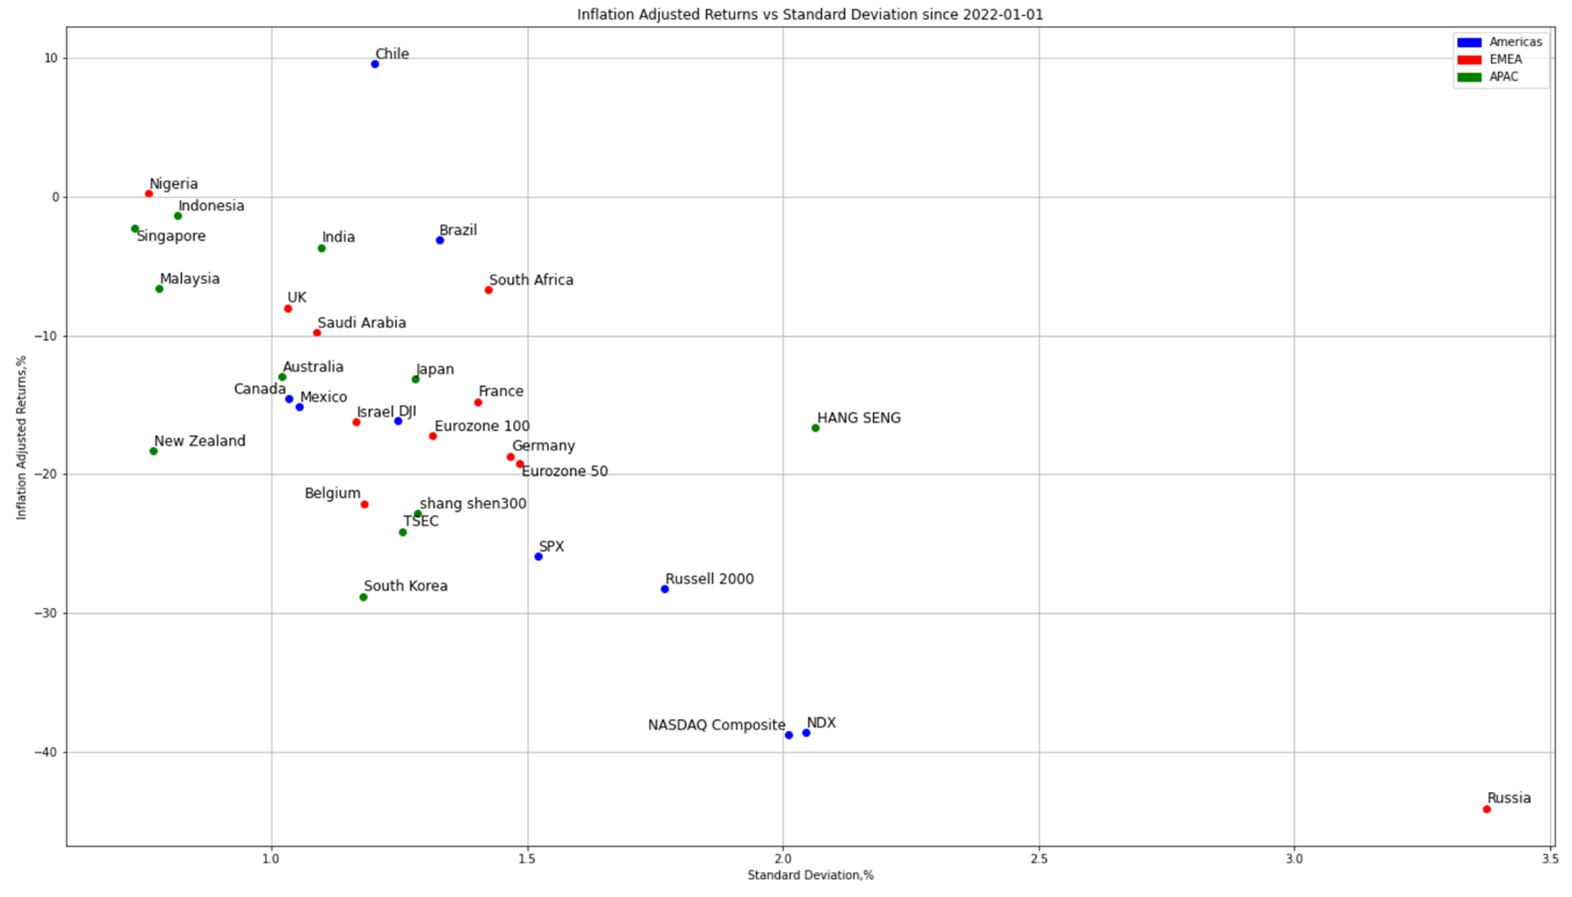
Observations since the all-time-high in the U.S. market (since 2022-01-01):
- The S&P 500 reached an all-time high on January 3, 2022. The performance of global financial markets has been mostly negative since then. Only [6] out of [31] market had a positive return.
- Chile (22%) was the best performing market, followed by Nigeria (19%), the latter was also the 2nd least volatile. The other markets with a positive return were Brazil (6%), Singapore (4%), India (3%), and South Africa (-0.1%). The Brazilian market maintained its volatility in the range of 1.4-1.6 in this period, as it did in the last 10- and 5-years, and since COVID.
- Russia was still and by far the most volatile market and one with the lowest return of -44%. It is notable that the Russian market was joined by the U.S. markets in the lagging group: NASDAQ 100 (-34%), NASDAQ Composite (-34%), Russel 2000 (-22%), and the S&P 500 (-20%). Other lagging markets were South Korea (-25%), CSI 300 (-21%) and the Taiwanese TSEC (-23%). The best performing U.S. index was the DJIA with a negative return of “only” -9%.
- The distribution of volatilities and returns in this period appears to have an inverse relationship. The better performing markets tended to have lower volatility. The relationship between volatility and returns has not been observed in any other periods if all markets were considered. The EMEA markets, again, appeared in the middle of the return and volatility distribution.
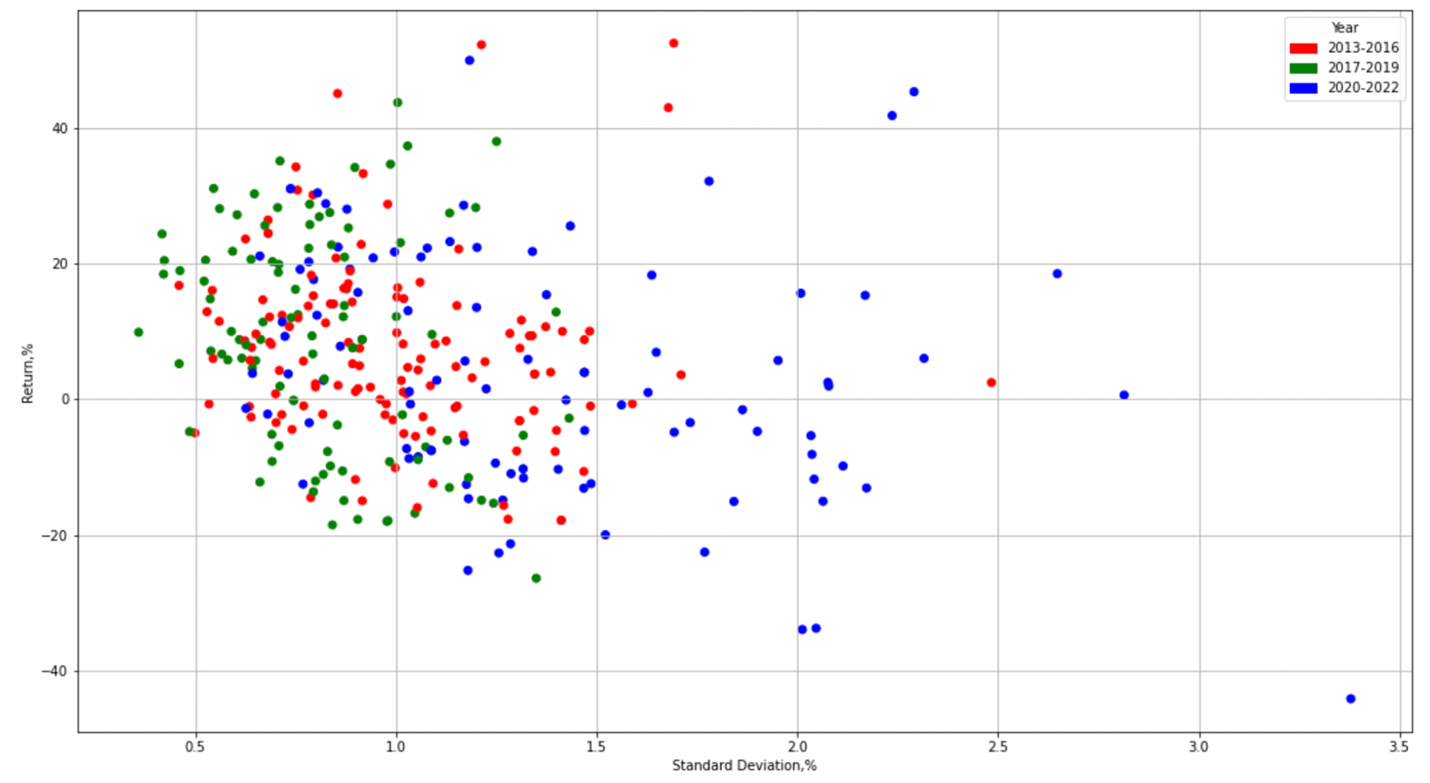
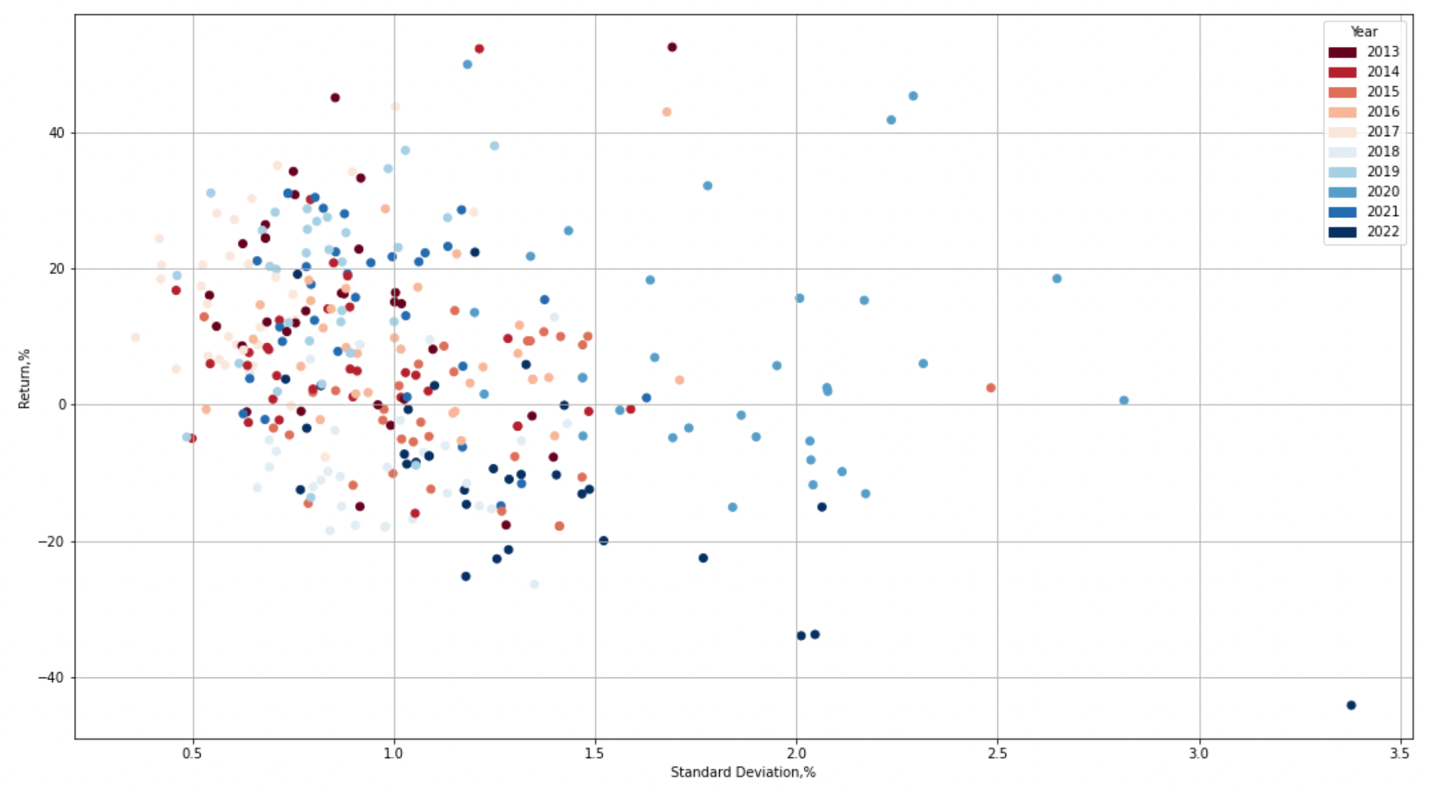
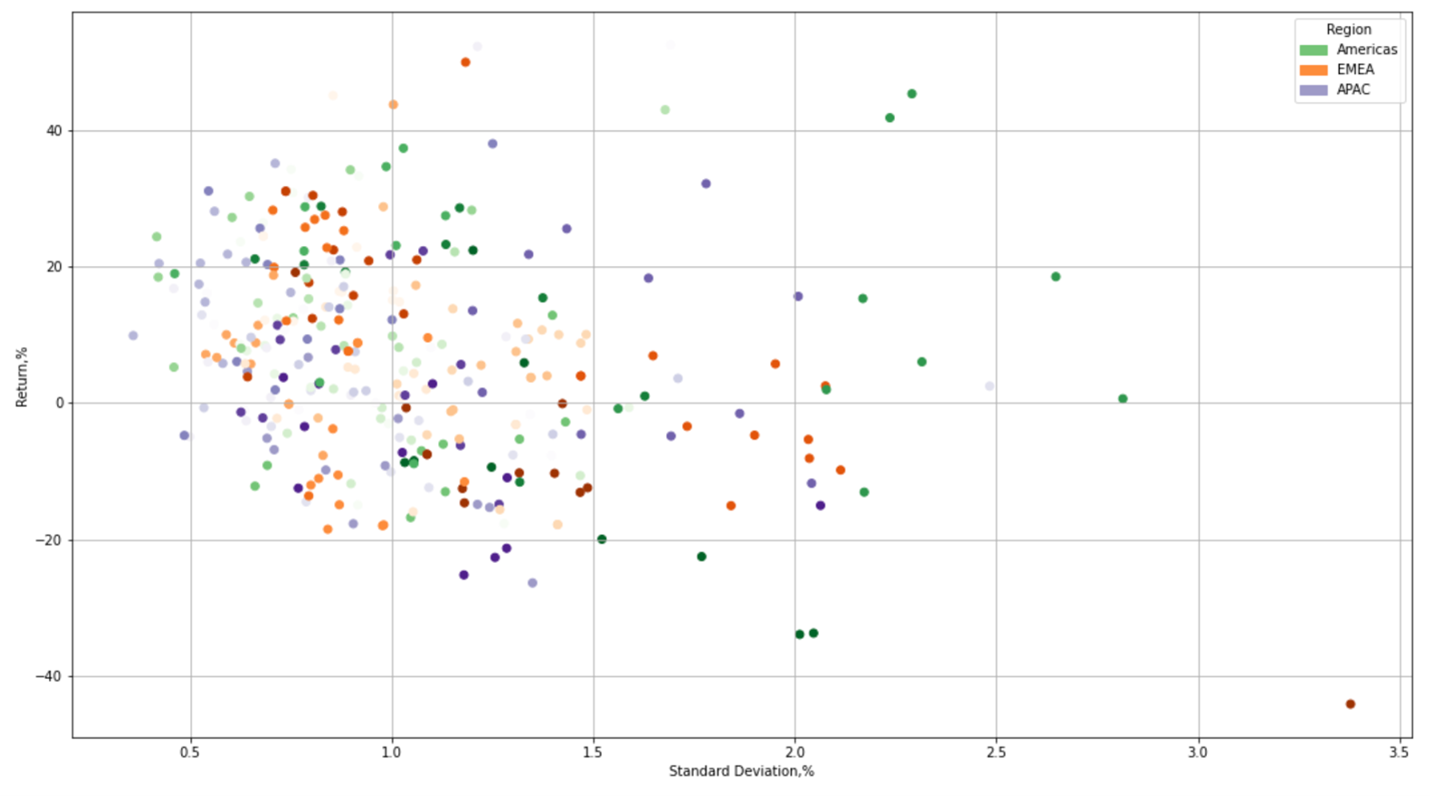
The annual returns of all markets grouped into three periods show how the 2020-2022 period was by far the most volatile since 2013. The following two visualizations offer more detail with each year represented by a color and returns grouped by region. We can see how 2022 returns have been mostly negative and with a standard deviation higher than 1.0.
The following charts show inflation adjusted returns of the stock markets over the last 10 years. Please note that annual inflation rates have been pro-rated to get inflation adjusted returns for mid-year periods.